How To Use the Tool
User Agreement
AGREEMENT TO ABIDE BY THE USER AGREEMENT: Use of Electrica constitutes an agreement to abide by the user agreement. Please read and review before continuing to the Tool.
Start here
Select Your Scenarios, Regions & Settings
1. Pick among nine predefined scenarios that explore different preset weightings for 11 different areas of focus. Example scenarios include a balanced approach, economic development, pollution and public health, light-duty, or freight focus, or explore scenarios that isolate one factor at a time. Select "More" for descriptions of each scenario.
2. Select your region(s) or state(s) of interest. Selecting the arrow to the right of regions will transfer your region states to individual states (if you want to further customize and add or cut states).
3. Select your global settings for two toggles: EV Momentum (whether to consider EV market momentum as rationale to prioritize a state) and Oil and Gas Opposition (whether to consider oil and gas opposition as rationale to prioritize a state or avoid a state). Select "More" for descriptions of these two toggles.
4. Clicking "Apply Selected Scenario” is only necessary if you previously adjusted sliders and are exploring a new scenario (see next step).
Note: It takes a little time to load data into your local computer’s memory - once loaded, adjusting your selections is fast. If you are inactive for a while, the tool may timeout (a popup will say “An error occurred - session timed out due to inactivity." Just hit "refresh" to dive in again.)

After selecting a starting point scenario, refine which factors and subfactors you are interested in by adjusting the sliders.
1. Move any slider to the right/high to indicate a higher relative importance (weighting) of the factor or subfactor. All the way to the left removes the factor or subfactor
2. To expand the subfactors, select “+ Show Subfactors.” If a factor is initially set to zero, be sure to expand the subfactors to make changes.


3. Select “More” for descriptions of each factor and its related subfactors.
Note: If, after exploring a customized scenario (adjusting sliders), you want to explore a different pre-defined scenario, be sure to click on "Apply Selected Scenario” to re-set the sliders.
Refine the weights to reflect your priorities
Explore your results - Summary and by factor

The right two-thirds of the screen presents results in three ways:
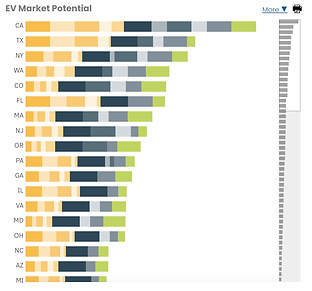
1. State Summary - the chart at the top
2. Maps - which are zoomable via a mouse scroll or the buttons on the map
3. Factor charts - the smaller charts under the map, which show all of the the subfactors and how they each score
A. For the factor charts, you can choose how you sort them - either by the State Summary order or individually
B. For all charts, you can see all 50 states by increasing or decreasing the chart’s visual range box (to the right of each chart)


Save and Share Your Results


To easily save and share your results, follow these steps.
-
Click on the yellow “Save, Share, and Create Custom Scenarios” button in the upper right corner of the page.
-
Click “Save Now”, which will create a pop-up box to title your current results.
-
Type in a title for your results, and click “Ok”. Note: You will be able to create multiple scenarios.
-
Your new title will display beneath “My Scenarios”, along with any other results you have saved.
A. To share a link, click the small clipboard to the right of the scenario you wish to share.
B. To delete one of your scenarios, click the red X next to the scenario you wish to delete.
Print Your Results
To create a PDF or print your scenario, follow these steps.
-
To print or PDF your entire results, click the printer icon in the upper right corner of the page, which says “Print All”. A new window will pop up in your browser. In the upper left-corner of your browser window you can click “File,” and “Print” (or hit Control P).
-
To print individual charts, select the smaller printer icon to the right of each of your charts. This will also open a new window, which you can use the “File,” “Print”.

Source: ElectricaTool.org Version 1.0,
pulled 9/28/21.

Please credit ElectricaTool.org, Version, the date you ran the scenario when sharing or referencing the data or results when sharing results.
Please refer to the Electrica Use Agreement for further details.
If you have any problems or technical questions, email them to Electrica@hovlandconsulting.com
How to Credit Electrica
Video Demonstrations
Below are a series of videos providing more background on Electrica, and how to use the tool.
Electrica Community Rollout Webinar
In case you missed the Electrica Community Rollout Webinar in September 2021, we invite you to view the videos below. It has been split into three short videos for your convenience.
Video 1: Introduction and Overview of Electrica
Electrica Community Rollout Webinar,
September 2021
Video 2: Electrica Demonstration
Electrica Community Rollout Webinar,
September 2021
Video 3: Panel Discussion With Electrica Advisors and Early Users
Electrica Community Rollout Webinar,
September 2021
© 2021. All Rights Reserved.
